The Quantum Dot Color Conversion Properties Based on Micro-LED Lighting
The Quantum Dot Color Conversion Properties Based on Micro-LED Lighting
Abstract
The quantum dot color conversion of micro-LED has the advantages of high brightness, high efficiency, and wide color gamut. It has broad application prospects in the display field. The single model and array model of quantum dots under the irradiation of micro-LED were established, and the optical properties such as the emission spectrum, luminous efficiency, and luminous angle of quantum dot color conversion were studied. Firstly, the CdSe/ZnS quantum dot monomer model was established in Light Tools. The simulated light source surface, quantum dot film layer, and detector were set up. The simulation results show that the three-color light generated by the quantum dot excited by the UV micro-LED is better than the blue light source in terms of color gamut. The color conversion efficiency of red and green quantum dots is higher. At the same time, with the increase of the emission angle of the excitation light source, the uniformity of the overall illuminance distribution of the outgoing light field is improved, and the light leakage in the ultraviolet region is reduced. A 6×6 single-array model of quantum dots was established, and the luminous effects of the two array models with and without microstructures were compared. By analyzing the true color image and illuminance map, it was found that the outgoing light field of the quantum dot array with microstructures has clear edges and clear color borders, which is suitable for high-definition screens.
Keywords
Micro-LED;Color Conversion;Optical Properties;Microstructure
1. Introduction
At present, society has entered the era of big data. Electronic devices such as mobile phones and tablets are rapidly popularizing and developing. The screen assumes the functions of information acquisition and exchange. With the advancement of technology, people's requirements for information acquisition efficiency on the screen, the quality of information transmission, and even the visual perception effect are gradually increasing. High image quality is the driving force behind the progress of screen display technology. Parameters such as resolution, color gamut, and contrast are the main basis for judging the image quality. Micro-LED is the smallest self-luminous display device with advantages such as high efficiency, low power consumption, high integration, and high stability. In addition, micro-LED is small, has high flexibility, and is easy to disassemble and combine. It can be applied to any existing display application with small and large sizes.
By integrating arrayed micro-LEDs and other light-emitting devices on an active addressing drive substrate, individual control and lighting of each device can be achieved. As a result, the resolution of the output image of the display can reach the theoretical maximum value. The effect of light-emitting mode on contrast is obvious. Active light-emitting display technologies such as organic light-emitting diode display (OLED) and micro-LED can control the brightness of each pixel and can theoretically achieve infinite contrast. The performance of passive light-emitting display technology represented by liquid crystal display (LCD) is slightly lower than that of OLED and micro-LED. The micro-LED can have a better display effect than LCD and OLED in many applications.
In terms of the color gamut of the display, the choice of backlight and fluorescent material is the decisive factor. The color gamut of LCD-TV is about 72%. With the emergence of 100% color gamut OLED, LCD-TV began to enhance the LED phosphor from YAG powder to RG powder, followed by KSF powder to improve the color gamut. The color gamut of LCD TVs has been increased to 96%, but it has never exceeded the color gamut of OLED. To catch up with OLED in color gamut, SONY and TCL have both launched TVs with quantum dot technology. Compared with fluorescent powder, the excitation spectrum of quantum dots is narrow and symmetrical. Besides, it has less stray light, and the excitation color is closer to the three primary colors specified by CIE. The displays using quantum dots can reach a color gamut of 110%.
Quantum dots are a class of materials composed of II-IV or II-VI elements with a size of about 1 to 10 nm. Quantum dots with different sizes have different fluorescence effects and can excite light fields of different colors. In general, the corresponding dominant wavelength of the excitation spectrum becomes shorter as the particle size decreases. Compared with conventional fluorescent dyes, the size of quantum dots can be adjusted. The emission and excitation bandwidths of fluorescence cover the spectral region from ultraviolet to infrared. The emission spectrum has a narrow and symmetrical shape and has excellent photostability and biocompatibility. Therefore, quantum dot display technology has great application prospects in laser electronics, display screens, and biomedicine.
In brief, the combination of micro-LED-based active light-emitting display technology and quantum dot color conversion technology for the construction of new microstructures is of great significance for display technology development toward high image quality. Therefore, this paper establishes a quantum dot single model and an array model based on micro-LED, simulating the physical process of quantum dot color conversion and studying the color gamut, illumination, and other optical properties of the output light field during the color conversion process.
2、The Principle of Color Conversion of Quantum Dot Film
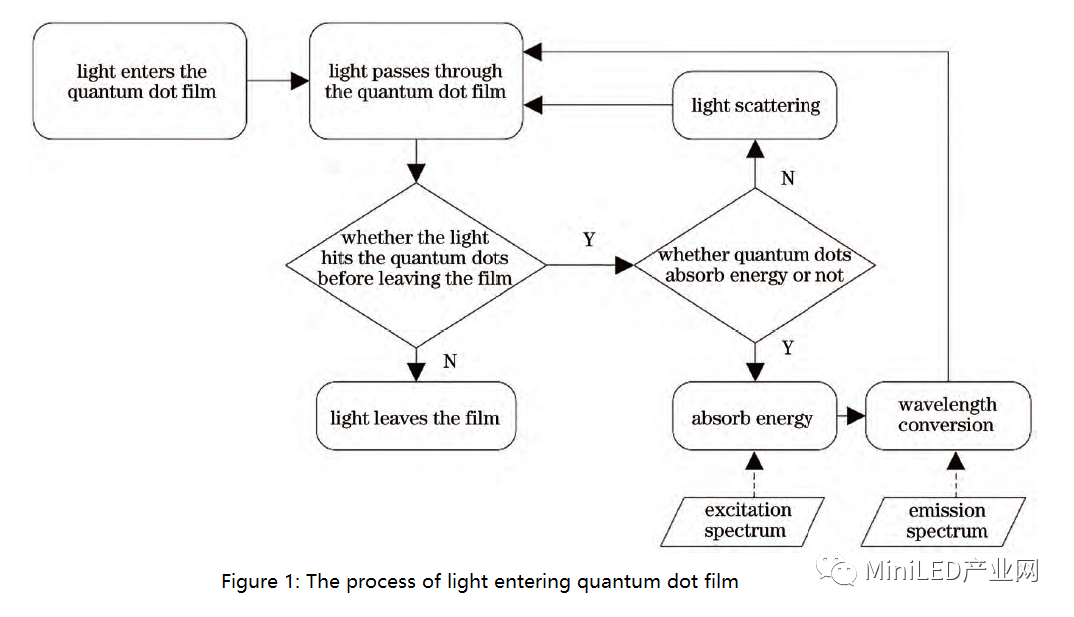
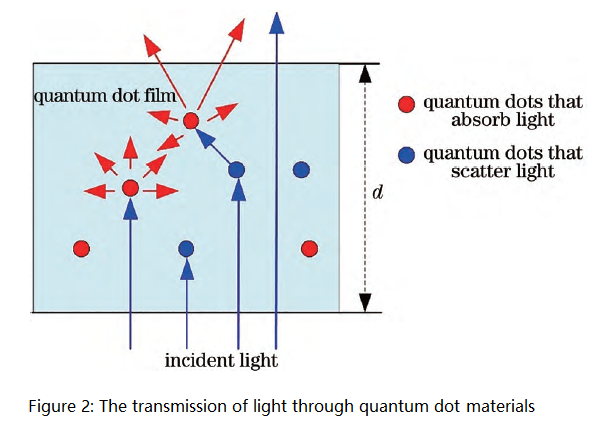
In quantum dot color conversion, the material exists in the form of a thin film. When the incident light hits the quantum dot thin film, the quantum dots are excited to emit light. The propagation process of the incident light field in the thin film is shown in Figure 1. When the light does not hit the quantum dot material before leaving the film, the light field will directly transmit through the quantum dot film, and the propagation direction remains unchanged. When the light field hits the quantum dot material other than absorbed by the quantum dot material, incident light will start scattering. The light field continues to propagate in the film after changing its direction. The absorbed incident light will participate in the color conversion process of the quantum dots. When the quantum dot absorbs photons and the corresponding excitation energy level exceeds the band gap, the material electrons transition from the ground state to the excited state, forming excitons with holes. The electron-hole pair releases energy in the form of radiative recombination or non-radiative recombination. Photons are produced in the radiative recombination process, releasing heat during non-radiative transitions. The band gaps of different kinds of quantum dot materials vary. Hence, the photon energy required to be absorbed during the excitation reaction is different, which is related to the material structure properties of quantum dots. Figure 2 is a schematic diagram of the transmission process of light in the quantum dot material, and d represents the thickness of the film layer.
The excitation light sources of the incident quantum dot film are blue light and UV light. The central wavelengths of the excitation light are 450 nm and 395 nm, respectively. Since the average size of quantum dot particles is much smaller than one-tenth of the wavelength of the excitation light, the scattering generated by the light source hitting the quantum dot film is mainly Rayleigh scattering. The physical process of Rayleigh scattering can be expressed as

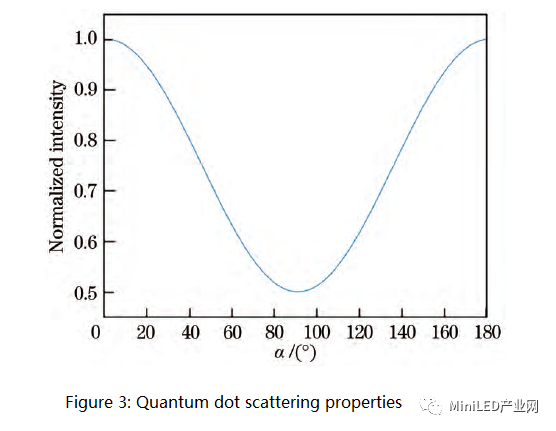
I represents the scattered light intensity. Ir is the incident light intensity. λ is the incident wavelength. n1 and n0 are the refractive indices of the particle and the dispersion medium. ν is the volume of a single particle. N is the number of particles in a unit volume. Equation (1) shows that the scattered light intensity of quantum dots is proportional to the fourth power of the frequency of the incident light wave. On the other hand, the Rayleigh scattering light intensity changes with the viewing direction. Its spatial light intensity distribution can be expressed as

I0 is the scattered light intensity in the direction of α = π/2. Equation (2) shows that the scattered light intensities obtained in different directions are different. The simulation of Rayleigh scattering characteristics is shown in Figure 3.
3、Color Conversion Model Based on Micro-LED
The research group selected the quantum dot material of CdSe/ZnS in the market for the TV screen backlight project. Light Tools software was used to build the quantum dot model. In the quantum dot material simulation, the excitation spectrum and emission spectrum of the quantum dot can be imported through the user-defined material module. When simulating different quantum dot materials, it is necessary to set up a new user material. The corresponding parameters of the quantum dot were imported into the material property menu, including particle size, excitation, emission spectrum, and other parameters. The radii of the quantum dot particles with three primary colors of emitted light are 4.6 nm (excitable red light), 3.1 nm (excitable green light), and 1.25 nm (excitable blue light). Figure 4(a)~( c) are the excitation spectrum curves of red, green, and blue colors, respectively. Figure 5(a)~(c) are the corresponding emission spectrum curves. Figure 6 is the schematic diagram of the parameter setting of quantum dots. The materials of the film were set to the corresponding quantum dot material in LightTools to complete the establishment of the quantum dot film.
The light source micro-LED model was simulated by a virtual surface light source called near-Lambertian light. UV light and blue light are chosen as comparisons. Figure 7 shows the excitation spectra of the two light sources. The spectral data of the two light sources were imported into the spectral region tab to complete the setting of the light source wavelength. Figure 8 is a schematic diagram of the light source parameter setting.
Finally, meter scattering mode was chosen in Light Tools. In this mode, the scattering mode automatically switches between meter scattering and Rayleigh scattering according to the particle size. The mentioned methods were used to construct the monomer and array color conversion models of micro-LED and quantum film. It is necessary to continue exploring the influences of parameters such as light sources, structures, and quantum dot materials on the luminous characteristics of the screens.
4. The Luminescence Properties of the Single Quantum Dot Model
The single quantum dot conversion model includes the light source, the quantum dot conversion film layer, and the detector. A square virtual surface with a unit size of 35 μm was the light-emitting surface of the light source. A cuboid with the same side area was chosen to simulate the quantum dot film layer. A virtual plane was plated above the thin film layer. The luminescence data was received by a detector. To facilitate data analysis, the setting light source power was
4.1 The influences of light source wavelengths
At present, the backlight of quantum dots consists of ultraviolet light and blue light. The reason for selecting blue light and ultraviolet light as the excitation light source for research is that the wavelength with a higher peak is generally selected as the excitation wavelength to detect the emission spectrum when analyzing the excitation spectrum of quantum dots. It can be found that the wavelengths of 395 nm and 450 nm of the two light sources in Figure 7 are both within the excitation spectrum range shown in Figure 4. The responsivity of these two light source wavelengths in the spectrum is higher than other wavelengths. It is necessary to excite three kinds of quantum dots via UV LED to generate three colors of light when using UV light as the backlight source. However, using blue light to illuminate only needs to excite two kinds of quantum dots. The advantages of using UV light are that the process is unified, the excitation efficiency is high, the modules are neat, and it is easy to process. The use of blue light can reduce the use of a quantum dot, and has no leakage of UV light to illuminate the human body. In order to study the influences of light sources on color conversion, the research group established a theoretical model and used different light sources to simulate light emission to ensure that the thickness and mass density of the quantum dot film are the same during the excitation process.
395 nm UV light and 450 nm blue light were set for the red quantum dot film for comparison to observe the luminescence characteristics of the quantum dot pixel block. The two sets of simulated true-color images are shown in Fig. 10(a) and (b). The output light of the quantum dot CdSe/ZnS film excited by ultraviolet light has a higher color contrast and brighter color than the light excited by blue light. Figure 10(c) shows the spectral distribution curves of the two groups of detectors. When the film thickness is 5 μm, the power of UV light to excite red light quantum dots is about 1.25 times that of blue light. A small fraction of blue light is directly emitted through the thin film, resulting in a decrease in the saturation of the excited red light.
Excitation simulations of UV and blue light sources were also set up for the green and blue CdSe/ZnS quantum dot films. The true-color images and detector spectra are shown in Figure 11 and Figure 12. When blue light LEDs illuminated the green quantum dot film, some blue light could still penetrate the quantum dot film, resulting in light source saturation decrease and light transmission. However, when UV light illuminated the green quantum dot film, the direct transmitted light power was small and the converted wavelength power was large, which behaved better than blue light sources. In the blue quantum dot thin film simulation, since the blue light source did not have an excitation conversion process and emission, the spectral power of the blue light detected by the detector was much larger than the optical power excited by the quantum dots irradiated by UV light. When detecting excited light substances such as quantum dots, the emission wavelength of the substance is generally determined, and then the excitation spectrum of the substance is scanned. The wavelength with a higher peak is selected as the excitation wavelength to excite the quantum dot material. It can be seen from the excitation spectrum of CdSe/ZnS in Figure 4 that the response of quantum dots to UV light is higher than that of blue light. Therefore, when simulating light sources with different wavelengths to illuminate red and green quantum dots, the illuminance power of the detector corresponding to UV light is higher.
4.2 The influences of light source angle
The light emitted by LEDs with different emitting angles has different propagation processes in the quantum dot film layer. The quantum dot film was simulated by light sources with different light-emitting angles, and the emission spectrum and detector illumination distribution were studied. The ultraviolet LED was used as the excitation light source. The power was 1W, and the change interval was 15°. The light emission angle α varied from 0° to 90°. The 0° was simulated by a surface light source that emits vertically. The spectral characteristics of the excitation light of different colored quantum dots on the receiver were observed.
Figures 14(a)~(c) are the detector receiving spectra of red, green, and blue quantum dot films, respectively. Figures 15(a)~(c) are the zoomed-in schematic of the UV areas of Figures 14(a)~(c). When the UV light with the same power irradiates the red, green, and blue quantum dots, the corresponding spectral peak power of the emitted light decreases in turn. All quantum dot material transmits a small amount of UV light in the range of 0° to 90°. The directly transmitted UV light decreases slightly with the increase of the emission angle. The direct transmission spectral power at 90° is about 80% of the transmittance power at 0°. Since the power value of the UV direct transmission is small, the change in the beam angle has a negligible effect on the total power and color gamut.
A detector was used to receive the light emitted from the quantum dots, and a smooth distribution was set for the illuminance data received by the detector to analyze the effect of the luminous angle on the illuminance. Figure 16 is a schematic diagram of the illuminance of the light emitted from the single quantum dot film on the detector. (a) is the illuminance distribution of the emitted light of the red quantum dot on the detector. The corresponding light source emission angles α from left to right are 0°, 30°, 60°, and 90°. (b) and (c) are the illuminance distributions of the emitted light of the green and blue quantum dot films on the detector. The corresponding incident light source emits the same angle as the red quantum dots. Since the data smoothing method connects the regions with similar data, the central illuminance of the detector at every angle is greater than the edge illuminance under the light source. Under the illumination of the red, green, and blue quantum dots with the same power light source, the illuminance of the emitted light of the red quantum dots on the detector is the largest. The illuminance of the emitted light of the blue quantum dots on the detector is the smallest, which has the same trend as Figure 14(a)~ (c). Since the incident light power is small, the illuminance distribution does not change significantly during the angle change. However, compared with the vertical emission of the light source, the illuminance distribution in the central area of the detector tends to be relatively uniform when the divergence angle is 90°. Besides, the green and blue quantum dot films irradiated by micro-LEDs with different luminous angles were performed. The result shows that the illuminance distribution was consistent with the red quantum dots. The uniformity of the central illuminance increases when angles get larger.

SAC solder paste SnBiAg solder paste SnBiAgSb solder paste SnBiAgX solder paste SnBi solder paste BiX solder paste AuSn solder paste SnSb solder paste SnPb solder paste Anisotropic conductive paste Flux for ultra-fine-pitch soldering

5. The Luminescence Properties of Arrayed Microstructured Quantum Dots
The array model is the repeated arrangement of a single model. The color of the unit display screen tends to be standardized, and the fineness is improved, avoiding the square simulation with the text size of 35 μm. A 6×6 light source matrix and a quantum dot film model with the edge of the icon appearing jaggedness, color fringing, and screen color polarization were produced. A detector was placed at the center of the matrix. The array model was set up, and the outgoing light of the quantum dots of different colors was received by the quantum dot thin film array. The colors were separated in the way shown in Figure 17(b). In the screen distribution showing the luminescence characteristics of the 5-array microstructure quantum dots, the three primary colors were arranged at intervals to ensure that the array model is a repeated arrangement of a single model. The color of the unit display screen tends to be standardized, improving the fineness and avoiding square simulation with the text and size of 35 μmA 6×6 light source matrix and a quantum dot film model with the edge of the icon appearing jaggedness, color fringing, and screen color polarization were produced. A detector was placed at the center of the matrix. The array model was set up, and the outgoing light of the quantum dots of different colors was received by the quantum dot thin film array as shown in Figure 17(a). The pixels are arranged at intervals according to the stripe shape. The quantum dot material film can be represented by the placement grid microstructure as shown in Figure 17(c).
The intensity of the UV light source for the three-color quantum dots was set. The three plots and detector illumination are shown in Figures 18–19. Figure 18 is the color image of the light emission of three-color quantum dot thin film when the illuminance is the same without the addition of micro-quantum dots under the structure of Figure 17(a) in the array of true-color structured grids. The angle of the outgoing light passing through the thin film is relatively large. The red and green quantum dots produce blurring of the same color at the edge of the material. However, the edge of the corresponding blue quantum dot materials not only include blue light blurring but also has red and green blurred light emitted by the quantum dots on the adjacent sides. Figure 19 is the detector illumination diagram of three-color quantum dots. It can be seen that the luminescent edges of each monomer are connected, and the edge width is large.
Figure 20 and Figure 21 are the true-color images and illuminance distribution diagrams of the detector under the structure of Figure 17(b). When the quantum dot material is separated by a microstructure grid, the color of the emitted light from each material unit is demarcated. There is no stray light in the light output of the three quantum dots in Figure 20, especially the area around the blue quantum dot film no longer has color mixing. It allows the color coordinates of blue light to move away from the red and green coordinates, slightly expanding the color gamut range. It can be seen from Figure 21 that the luminous edge of each single quantum dot is clear after adding the microstructure. There is a gap between the units. The quantum dot material microstructures can make the light-emitting pixels more regular. Hence, grids can improve the quality of the screen in all aspects.
It can be seen from the above simulations that the use of microstructures can improve the light field distribution of quantum dot arrays and the light field distribution of quantum dot arrays when adding microstructures. Figure 22 is a schematic diagram of the light field distribution of the quantum dot array without adding microstructures and when adding microstructures. Without the addition of microstructures, the true-color image of the detector shows that the edges of the red and green quantum dot monomer films are blurred with the same color, which is due to the light field distribution range of the outgoing light after the quantum dot film is excited by ultraviolet light exceeds the film size. At the same time, there are blurred lights of blue, red, and green around the film of blue quantum dots. It is because the wavelength of blue light is still within the excitation spectrum range of red and green quantum dots, so when ultraviolet light excites blue light, the outgoing blue light is then incident into the adjacent color quantum dot material. The red and green quantum dots are excited twice, as shown in Figure 22(a). The reason why the microstructure can improve the luminescence of the quantum dot array and make the color of the array clearer is that the absorbing material or reflective material used in the microstructure separates the quantum dot films of different colors in the plane as shown in Figure 22 (b) shown. The grid structure confines the light-emitting range of the quantum dot monomer as much as possible within its size, avoids the overlapping of the light-emitting regions of different quantum dot monomers, reduces blue light entering adjacent quantum dots, and generates secondary excitation, thereby enhancing the uniformity brightness in quantum dot arrays and color doping issue.
6. Conclusion and Outlook
The color conversion model of quantum dots for monomers and arrays was designed by using micro-LED based on the luminescence characteristics of quantum dots and the actual parameters. By changing parameters such as light source characteristics and mechanical structure, the light emission characteristics of quantum dot films were simulated. The simulation results show that the excitation power of UV light for red and green quantum dots is higher for the single quantum dot film under different light sources. The screen using UV light as the direct backlight has a wider color gamut than the blue backlight screen. When the quantum dots are irradiated with the same power light source, the excitation power of the red, green, and blue quantum dots decreases in turn. In addition, as the luminous angle increases, the average illuminance of the quantum dot film irradiated to the center of the detector is stronger. The illuminance distribution is more uniform, and the light transmission power becomes smaller. For array light sources, the mechanical microstructure limits the light-emitting shape of the quantum dot film to a certain extent. When applied to the screen display, color mixing can be avoided. Thus, each pixel block of the screen has a clear color boundary.
Authors of the paper: Wang Leran, Li Fulin, Sun Yixuan, Liu Xiaojie, Yang Lei and Xie Hongbo. Retrieved and edited by Fitech
Journal: Advances in Lasers and Optoelectronics (December 2021)




 Back to list


